Pharma Data Analytics (Pharma Intelligence): Opportunities and Challenges in the Multi-Omics Era of Drug Discovery and Development
-
Benedito Faustinoni Neto
BioDecision Analytics limited, Zip code 05713-510, São Paulo-SP, Brazil
João Rafael Dias-PintoManagement of Getulio Vargas Foundation, Zip code 01.313-902, São Paulo-SP, Brazil
Rodrigo Pinheiro Araldi
Post-graduation Program in Structural and Functional Biology, Paulista School of Medicine, Zip code 04.023-900
São Paulo Federal University, São Paulo-SP, Brazil
| Received 12 Jan, 2023 |
Accepted 14 Apr, 2023 |
Published 16 Jun, 2023 |
Although the advent of “Omics” technologies (genomics, transcriptome, proteome and metabolome) has allowed overcoming the challenges imposed by the traditional empirical drug development models, facilitating drug discovery and development, these technologies have contributed to the generation of a large volume of data (pharma big data). Due to the complex nature of the (bio) pharmaceutical data, which count on structured and non-structured data, conventional statistic techniques are not sufficient to efficiently explore these datasets, which could lead to noise accumulation or spurious correlation. In this context, data analytics offers a set of appropriate statistical techniques that, combined with Artificial Intelligence (AI) have allowed overcoming the challenges imposed by the Pharmaceutical Big Data Era. The applications of these techniques in the (bio) pharmaceutical sector have allowed for a selection of features of interest, revealing unexpected correlations among multi-Omics, preclinical and clinical data, reducing the time and cost for drug discovery. Based on this, this review aims to summarize the most useful applications of pharma data analytics (pharma intelligence), discussing the opportunities and challenges offered by this new field of investigation.
| Copyright © 2023 Neto et al. This is an open-access article distributed under the Creative Commons Attribution License, which permits unrestricted use, distribution, and reproduction in any medium, provided the original work is properly cited. |
INTRODUCTION
According to the Global Burden of Disease (GBD) Study, the global impact of non-communicable diseases (NCDs) has grown over the last three decades1-4. During this time, the notorious advances in medicine and sanitary conditions improvements significantly reduced the incidence and mortality of infectious diseases, creating an epidemiological transition scene. This scene is characterized by an increasing incidence of cardiovascular, chronic respiratory diseases, mental health and neurological disorders and diabetes as a consequence of the aging of the human population5-9. Data from a study commissioned by Roche showed that NCDs kill approximately 41 million people each year, being responsible for 71% of all deaths globally reported10.
The macroeconomic burden of NCDs over the period, 2011-2030 will cost the global economy US$ 30 trillion, representing 48% of the global gross domestic product (GDP) in 201010. Based on this, several initiatives have inspired countries to launch policies, good practices and investments in Research, Development and Innovation (RD&I) of novel drugs able to reduce the economic impacts of NCDs. This is because, for each $1 invested in cost-effective solutions for the prevention and control of NCDs, it is expected a return of at least $7 by 203011. Moreover, a recent estimation for drug and diagnostic for NCDs estimates that the current market size is US$ 346 billion growing at a compound annual growth rate of approximately 7.2% from 2021 to 202611. This epidemiological transition scene has driven the (bio) pharmaceutical industry to invest in RD&I of novel products able to prevent or treat these NCDs.
Over the last two decades, the changing landscape of drug RD&I evidenced significant disadvantages of the traditional empirical drug development models11. The empirical drug development model is centric to meet predefined regulatory requirements and get market access instead of addressing the current complex challenges of RD&I productivity. In addition, historical evidence indicates that the traditional empirical drug development model not only increases the time to obtain the registry of new (bio) pharmaceutical products for the treatment of NCDs but also cause economic losses to all pharmaceutical supply chain. The primary failure rates are attributed to efficacy failure in late-stage clinical phases of drug development followed by patient safety concerns. Moreover, the lack of superior outcomes to established therapies, a demonstration of commercial potential, insufficient financial budget and regulatory submission challenges are other emphasized attributes of late-stage attrition of new molecular entities.
However, the advent of “Omics” technologies has mitigated the challenges from the empirical drug development model, revolutionizing the RD&I in the (bio) pharmaceutical sector.
Omics technologies are high-throughput biomolecular analytical techniques that include genomics, transcriptome, proteome and metabolome to quantitatively access the levels of all genes, transcripts, proteins and metabolites produced by target cells or tissues. On the one hand, the combined use of these techniques (multi-Omics) has accelerated the drug RD&I, on the other hand, these multi-Omics tools have contributed to the generation of high amount of data (Big data) which are not efficiently used by (bio)pharmaceutical industry to generate valuable insights12-14. In addition, despite the technical recommendation to guarantee the best practices for RNA-Seq data analysis and the multitude of bioinformatic and statistical tools available, RNA-Seq results are still limited to providing molecular information12-14. For this reason, even in this Omics Era, the (bio) pharmaceutical industry remains using traditional empirical drug development models, especially to provide proof of concepts for regulatory purposes. This is because, data from Omics technologies are not properly and adequately correlated to preclinical and clinical results, requiring novel experiments as proof of concept for Omics data.
Thus, (bio) pharmaceutical industries have accumulated an enormous number of multi-Omics, in vitro, preclinical and clinical data, resulting in a novel and complex problem for Pharmaceutical Big Data Era: How to analyze these datasets with efficiency to provide valuable information to support the drug RD&I?
The problem occurs due to the complex nature of these pharmaceutical data, which combine structured (tabular data) and non-structured data (image bank, sound and video recording) which difficult the extraction of valuable information15. This is because the conventional statistical techniques are not sufficient to efficiently explore these datasets. Besides this, these techniques can generate noise accumulation or spurious correlation negatively impacting the decision-make process associated with the drug RD&I15,16.
Noise accumulation occurs due to the accumulation of estimation errors when the prediction is based on many parameters, reducing the predictive power of the model. Spurious correlation occurs when a large number of variables are evaluated and, a target variable is highly correlated with other variables with which they do not correlate15.
Both noise accumulation and spurious correlation occurs because standard statistical tests assume that a single hypothesis is tested. However, when multiple hypotheses are tested simultaneously, there is a higher probability of a Type I error (false-positive)-an incorrect rejection of a true null hypothesis15. Thus, the advances in Omics Era mandatorily require integrative and multidisciplinary knowledge.
In this context, the use of different statistical techniques set from data analytics, along with predictive modeling and machine learning has allowed us to overcome the challenges imposed by the Pharmaceutical Big Data Era15,16. This is because, the combined use of these tools has allowed to a selection of variables of interest, revealing unexpected correlations among these variables and significantly reducing the time and cost of drug discovery16.
Considering the current importance of transcriptome in the Omics Era of the pharmaceutical industry, this review aims to discuss the challenges to efficiently explore the high amount of data (Big data) generated using this technology under a Data Analytics and Artificial Intelligence (AI) perspective.
RNA-Seq data analysis: From basic recommendations to Artificial Intelligence (AI)-based analysis: The advent of high-throughput techniques presents both challenges and opportunities to the (bio) pharmaceutical industry17. Among these techniques, transcriptome, which includes RNA sequencing (RNA-Seq), single-cell RNA sequencing (scRNA-Seq) and most recently the third-generation sequencing approaches such as DropSeq and in drop in stands out due to their capability to assess qualitative and quantitatively the gene expression levels, reveling regulation characteristics and the molecular mechanisms in the process of diseases and regulated pathway affected by drug intervention18. For these reasons, it is not surprising that data from tratranscriptomve have been used to predict the mechanism of action (MOA) of investigational products (IP) and identify possible toxic effects related to the use of the IP19,20.
Due to the analytical complexity of the RNA-Seq data, several recommendations have been proposed by the literature to guarantee the quality of the results obtained with this technique12,21,22. In general, these recommendations are focused on experimental questions, such as the number of samples, sequencing depth, quality control, read alignment and quantification of gene levels12,21,22. Despite these recommendations, there is no single analysis pipeline to be used in all cases. In this sense, the multiple bioinformatic tools, especially those applied to assess the differential expression, make the RNA-Seq data analysis a laborious task, requiring basic knowledge of genetics, bioinformatics and statistics. Moreover, functional enrichment analysis of genes differently expressed (identified in RNA-Seq) can lead to different predictions according to the database used to perform these analyses, contributing to the generation of spurious results.
In this sense, some basic aspects may be attempted to guarantee the applicability of RNA-Seq for pharmaceutical purposes. Although this review does not aim to propose the rules for the best practice of RNA-Seq analysis, herein we summarize some useful recommendations that can be generically applied for all studies that use RNA-Seq to assess the differential gene expression:
• |
RNA isolation/extraction: The use appropriate commercial or in-house protocols to remove the highly abundant ribosomal RNA (rRNA), which typically constitutes over 90% of the total RNA in the cells |
|
• |
RNA concentration and integrity: Quantify and check the RNA integrity with the appropriate method (preferentially using the BioAnalyzer). To guarantee the sequencing quality, use samples with RNA integrity number (RIN) greater than sex (RIN>6) |
|
• |
Selection of Poly(A) transcripts: Considering that in eukaryotic most protein-coding RNAs (mRNAs) and many long noncoding RNAs (lncRNAs>200 nt) contain a polyadenylated tail-poly(A), which provides a technical opportunity for enrichment of both mRNAs and lncRNAs23. As a useful alternative, poly(A) tail can be selected using oligo-dT priming for reverse transcriptase (RT). However, considering that the polyadenylation exclusively occurs at the 3' end, this method can result in sequencing reads enriched for the 3' portion of the transcript. In addition, Oligo-dT can also prime at internal A-rich sequences (phenomenon called internal poly(A) priming), leading to biased RT. For these reasons, poly(A) purification-based techniques remain to be a preferred method to select mRNAs and lncRNAs23 |
|
• |
Ribosomal RNA (rRNA) depletion: For instance, non-poly(A) RNAs, such as prokaryotic mRNA, fragmented mRNAs from formalin-fixed, paraffin-embedded (FFPE) samples are often the subject of investigation. In these cases, poly(A)-based methods for purifying these RNAs are not adequate, requiring rRNA depletion. Several techniques are available for this purpose. These techniques include (i) Hybridization with biotinylated DNA or locked nucleic acid (LNA) probes, followed by depletion with streptavidin beads, (ii) Antisense DNA oligos target to rRNA, followed by digestion with RNase H (probe-directed degradation PDD) and (iii) Circularization of all cDNA (including those of rRNAs), followed by hybridization with rRNA probes and digestion with duplex-specific nuclease (DNS) etc.23 |
|
• |
Fragmentation: Both poly(A) enriched or rRNA depleted RNA samples may be fragmented to a certain size range due to the limitation of sequencing platforms (<600 bp). RNA fragmentation can be performed using alkaline solutions, solutions with divalent cations, such as Mg2+ or Zn2+ or enzymes such as RNase III23 |
|
• |
Single-(SE) or paired-end (PE) reads: Define in the experimental design whether only one cDNA strand (3' or 5', SE) or both cDNA strands (3' and 5', PE) will be sequenced. In general, SE reads are sufficient for studies of gene expression levels in well-annotated organisms, whereas PE reads are preferable to characterize poorly annotated transcriptomes. For de novo transcript discovery or isoform analysis, preferably use PE sequencing12 |
|
• |
Sequencing depth or library size: Considering that more transcripts will be detected and their quantification will be more precise as the samples are sequences to a deeper level, work with a sequencing depth between 25-100 million reads, preferably 50 million reads12 |
|
• |
Number of replicates: Although the number of replicates depends on both the amount of technical variability in the RNA-Seq procedures and the biological variability of the system under study, currently recommendations have proposed at least four replicates to guarantee the desired statistical power12 |
|
• |
||
• |
Read alignment: Use an appropriate aligner to map the about the genome control. Different aligners are available for this purpose, such as BWA26, RUM27, Bowtie 228, Tophat 229 and HISAT230. However, the Spliced Transcripts Alignment to a Reference (STAR) became one of the mst used aligner for RNA-Seq31,32. This is because, this aligner can detect canonical junctions and discover non-canonical splices and fusion transcripts33,34 |
|
• |
||
• |
Normalization: Raw read counts alone are not sufficient to compare expression levels among samples, as these values are affected by factors such as transcript length, the total number of reads and sequencing bias12. For this reason, use appropriate techniques to normalize the row read counts. Different methods are used for this purpose, however, the transcripts per million (TPM)12 and most recently, DESeq235,36 or edgeR37 are the most commonly and appropriated normalization techniques to compare the genes differentially expressed among samples |
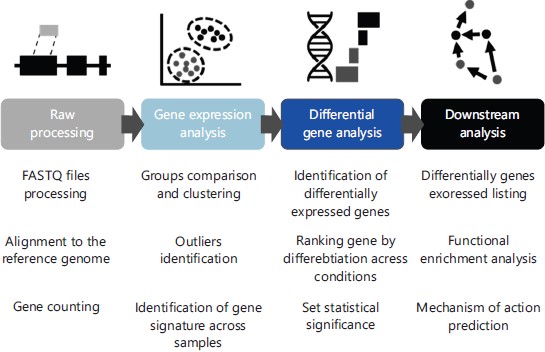
Despite these recommendations, the RNA-Seq dataset analysis is still a complex and laborious task. This is because, there are various statistical methods and, most recently, Artificial Intelligence (AI)-based technologies available to help the RNA-Seq analysis process. A summary of the steps comprised in a basic RNA-Seq data analysis pipeline was shown in Fig. 1.
Statistical analyses: Comprise a mandatory set of techniques that are required to analyze and visualize results from in vitro, preclinical and clinical studies, allowing to identification of main patterns. In terms of transcriptome analysis, statistical-based techniques are effective in finding gene groups of interest38. Although crucial, statistical methods are not sufficient to analyze the high amount of data generated by the (bio) pharmaceutical industries. In this sense, AI technologies have allowed us to analyze these data, identifying features of interest (feature selection) from Omics, preclinical and clinical data. Combing appropriated statistical methods and AI as Data Analytics tools, it is possible to identify correlations between these data, providing valuable information that could accelerate the RD&I for the (bio) pharmaceutical sector.
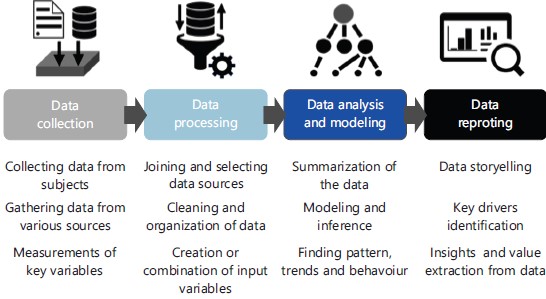
Pharma data analytics (pharma intelligence): Data analytics (or analytics) represents an extensive field of investigation of raw data, which has been used for more than two decades in the financial sector and most recently, applied to the (bio) pharmaceutical sector (Pharma Data Analytics). Data analytics combines statistical and AI techniques to process and evaluate data, identifying patterns and behaviors that can support decision making processes. This process is divided into sequential steps that involve: (i) Data collection, (ii) Processing, (iii) Analysis and modeling and (iv) Data reporting, as shown in Fig. 2.
|
|
However, the high amount of data accumulated from multi-Omics, in vitro, preclinical and clinical studies generated along the drug discovery and development required the implementation of computational tools to facilitate these steps. In this sense, the advent of Artificial Intelligence (AI), a core branch of Computer Science, allowed us to concatenate these steps, generating valuable information that reduces both time and costs of RD&I of (bio) pharmaceutical industries17,39. Thus, the applications of these tools in the pharmaceutical sector have revolutionized drug discovery and development, resulting in the Pharma Intelligence Era.
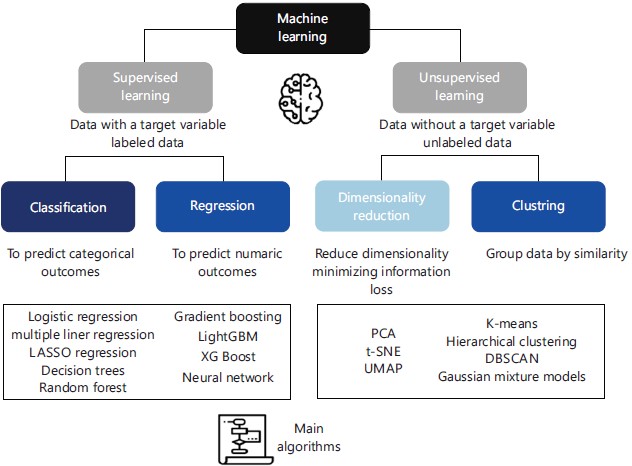
Although there are many definitions and subclassifications of AI available in the literature, AI technologies can be divided into two categories: (i) Machine learning (ML) and (ii) Deep learning38.
Machine learning uses algorithms that progressively learn from data, identifying relationships and making predictions of a phenomenon of interest. The techniques can be subdivided into (i) Supervised and (ii) Unsupervised approaches according to the type of data available and the objectives of the analysis. In the supervised approach, the data have a target variable that is intended to predict and analyze. The unsupervised approach, by contrast, does not involve a target of interest and the algorithm looks for patterns within the data set.
Supervised learning is used to predict categorical (classification) or numeric outcomes (regression). Unsupervised is used to reduce the dimensionality of Big Data (dimensionality reduction) or to group data by similarity (clustering), as described in Fig. 3.
|
Deep learning is a very active area of research in AI communities38,40. Deep learning is based on the neural network. For this reason, it is also known as deep neural networks (DNNs)39,41. Neuronal networks were first thought in the late 1980s. However, the neuronal networks resurfaced after 2010, after many problems had been resolved with a new architecture41. Since then, deep learning has been effectively applied in many fields, including pharmacy38,40.
Using neural networks, deep learning can model biological complexity, serving as a useful and powerful tool applied to image analysis of research subjects of clinical trials, including images from computerized tomography42,43 and/or magnetic resonance44-46 or even histopathological images47.
Feature engineering and selection: On the one hand, the multi-Omics Era has provided multiple data to support drug discovery and development, on the other hand, the amount of data produced by these techniques requires techniques to reduce the multidimensionality of these data and tools able to correctly identify the most important features (attributes/variables) to provide information. However, this problem is not restricted to the Omics data. This is because, to obtain the registry of a novel drug, (bio) pharmaceutical companies generate many data from in vitro, preclinical and clinical studies to provide evidence of the safety and benefits of the investigational product. Thus, even the empirical drug development model can be considered a source of Big Data.
In this scene, one of the biggest challenges to accelerate the RD&I in the (bio) pharmaceutical sector is to identify among the numerous analyzed features, those that are relevant. In this context, data analytics has contributed to the identification of valuable features through two techniques: (i) Feature engineering (FE) and (ii) Selection (FS).
Features capture salient aspects of the phenomenon or process of interest. However, the unappropriated use of these features can deviate From the results, leading to noise accumulation that contributes to spurious correlation48. For this reason, the selection of aappropriate features is a crucial step to improve the performance of ML algorithms.
Although there are many pre-processing steps for the inputs to be fed into an algorithm for the learning process, feature engineering and selection remain challenging for both data scientists and analytics48,49. This is because, a good feature should be (i) Informative, (ii) Never change for the set of transformations and (iii) Fast computing48,49.
To facilitate the selection of a good feature, variables are commonly classified as: (i) Strongly relevant (always preferred), (ii) Weakly relevant (that, when adequately combined with strongly relevant features, can improve relevance to the problem), (iii) Irrelevant (may be discarded) and (iv) Redundant (which may be ignored or removed48,49).
Based on this, computational methods of FE e FS have been applied to identify good features. The FE is divided into (i) Feature transformation and (ii) Feature creation. Feature transformation involves the cleaning/pre-processing techniques (missing data and outlier treatment, categorical encoding, variable transformation, discretization, data and time engineering), followed by the transformation of variables into formatted features48,49. Next, it is generated new features based on existing attributes (feature creation48). The better features generated in FE step may be selected using algorithms to discover good features (FS step)50. Combined, the FE and FS techniques avoid overfitting and improve model performance, providing the most and more cost-effective model and offering insight into the underlying processes that generated the data51.
In terms of FS, it is important to guarantee the stability of the feature selection algorithm51. Stability provides the best objective criteria to choose the feature selection algorithm, providing a high-quality feature subset and higher confidence in better classification performance51.
CONCLUSION
Working with multi-disciplinary teams and using Data Analytics, pharmaceutical industries have been transformed into multiple large multidimensional datasets to identify phenotypes and early predictors of patient disease activity and progression. The information provided by these technologies have been revolutionized the (bio) pharmaceutical sector, allowing to identify new targets and compounds that can be developed into new drugs, facilitating drug discovery and development. The applications of Data Analytics have also contributed to the development of personalized medicine. This is because, the (re) analysis of the large volume of clinical data, such as medical histories allows us to identify subgroups of patients for whom investigational products or already licensed drugs are most effective. In addition, the combined use of statistical techniques and AI have allowed identify and select relevant features, accelerating the registry process. However, the applications of Pharma Data Analytics are not limited to the research and development of drugs. These tools are also useful to monitor the safety of drugs (pharmacovigilance) and quickly identify potential risks related to the use of a specific drug. Due to the multiple techniques available, as well as the complexity of these tools, that require knowledge in data science, statistics and analytics, Data Analytics, even in Pharma, remains disconnected from the life science. Thus, undoubtedly, the main challenge to overcome in the next years is to extract the predictive power of Pharma Data Analytics by increasing the participation of professionals from most different areas, creating multidisciplinary teams of Data Analytics to provide valuable insight for the RD&I in (bio) pharmaceutical sector.
SIGNIFICANCE STATEMENT
The advents of novel technologies able to assess all genes, transcripts, proteins and metabolites produced by the cells (known as Omics technologies) have generated a high volume of data for (bio) pharmaceutical companies (Pharma Big Data). Although necessary (especially for the regulatory process), the statistical methods are not sufficient to extract valuable information from this dataset. In this sense, the application of Artificial Intelligence (AI)-based technologies with appropriate statistical techniques (Pharma Data Analytics) has enabled the analysis of these Pharma Big Data, revolutionizing pharmaceutical research, development and innovation. For this reason, this review discusses the opportunities and challenges of the application of these analytical technics in the pharmaceutical sector.
REFERENCES
- Araldi, R.P., A.T. Ramos, A.L. Alievi, B. Policíquio, M.R. Teixei and T.B. Mendes et al., 2022. Nestacell® promotes motor, cognitive and neuropsychiatric functions amelioration and dopaminergic neurons restoration in a pre-clinical model of Parkinson's disease. Cytotherapy, 24.
- da Costa, V.R., R.P. Araldi, H. Vigerelli, F. D’Ámelio and T.B. Mendes et al., 2021. Exosomes in the tumor microenvironment: From biology to clinical applications. Cells, 10: 2617.
- Kerkis, I., R.P. Araldi, C.V. Wenceslau and T.B. Mendes, 2022. Advances in Cellular and Cell-Free Therapy Medicinal Products for Huntington Disease Treatment. In: From Pathophysiology to Treatment of Huntington's Disease, Szejko, N. (Ed.), IntechOpen, London, UK, ISBN: 978-1-80355-427-3.
- Araldi, R.P., T.C. de Melo, D. Levy, D.M. de Souza and B. Maurício et al., 2020. LIMD2 regulates key steps of metastasis cascade in papillary thyroid cancer cells via MAPK crosstalk. Cells, 9: 2522.
- Araldi, R.P., B.C. Prezoto, V. Gonzaga, B. Policiquio and T.B. Mendes et al., 2022. Advanced cell therapy with low tissue factor loaded product NestaCell® does not confer thrombogenic risk for critically ill COVID-19 heparin-treated patients. Biomed. Pharmacother., 149: 112920.
- Murray, C.J.L., 2022. The global burden of disease study at 30 years. Nat. Med., 28: 2019-2026.
- Lichtenberg, F.R., 2022. The effect of pharmaceutical innovation on longevity: Evidence from the U.S. and 26 high-income countries. Econ. Hum. Biol., 46: 101124.
- Siegel, R.L., K.D. Miller, N.S. Wagle and A. Jemal, 2023. Cancer statistics, 2023. CA: Cancer J. Clin., 73: 17-48.
- Ou, Z., J. Pan, S. Tang, D. Duan, D. Yu, H. Nong and Z. Wang, 2021. Global trends in the incidence, prevalence, and years lived with disability of Parkinson’s disease in 204 countries/territories from 1990 to 2019. Front. Public Health, 9: 776847.
- Ouyang, F., X. Cheng, W. Zhou, J. He and S. Xiao, 2022. Increased mortality trends in patients with chronic non-communicable diseases and comorbid hypertension in the United States, 2000-2019. Front. Public Health, 10: 753861.
- Subramanian, S., R. Gakunga, J. Kibachio, G. Gathecha and P. Edwards et al., 2018. Cost and affordability of non-communicable disease screening, diagnosis and treatment in Kenya: Patient payments in the private and public sectors. PLoS ONE, 13.
- Conesa, A., P. Madrigal, S. Tarazona, D. Gomez-Cabrero and A. Cervera et al., 2016. A survey of best practices for RNA-seq data analysis. Genome Biol., 17: 13.
- Chung, M., V.M. Bruno, D.A. Rasko, C.A. Cuomo and J.F. Muñoz et al., 2021. Best practices on the differential expression analysis of multi-species RNA-seq. Genome Biol., 22: 121.
- Luecken, M.D. and F.J. Theis, 2019. Current best practices in single‐cell RNA‐seq analysis: A tutorial. Mol. Syst. Biol., 15: e8746.
- Hernandez, I. and Y. Zhang, 2017. Using predictive analytics and big data to optimize pharmaceutical outcomes. Am. J. Health-Syst. Pharm., 74: 1494-1500.
- Parikh, S., R. Patel, D. Khunt, V.P. Chavda and L. Vora, 2023. Data Analytics and Data Visualization for the Pharmaceutical Industry. In: Bioinformatics Tools for Pharmaceutical Drug Product Development, Chavda, V., K. Anand and V. Apostolopoulos, Wiley, United States, ISBN: 9781119865728, pp: 55-76.
- Vamathevan, J., D. Clark, P. Czodrowski, I. Dunham and E. Ferran et al., 2019. Applications of machine learning in drug discovery and development. Nat. Rev. Drug Discov., 18: 463-477.
- Yang, X., L. Kui, M. Tang, D. Li and K. Wei et al., 2020. High-throughput transcriptome profiling in drug and biomarker discovery. Front. Genet., 11: 00019.
- Nguyen, N., D. Jennen and J. Kleinjans, 2022. Omics technologies to understand drug toxicity mechanisms. Drug Discovery Today, 27: 103348.
- Hsieh, C.Y., J.H. Wen, S.M. Lin, T.Y. Tseng and J.H. Huang, H.C. Huang and H.F. Juan, 2023. scDrug: From single-cell RNA-seq to drug response prediction. Comput. Struct. Biotechnol. J., 21: 150-157.
- Tarazona, S., P. Furió-Tarí, D. Turrà, A.D. Pietro, M.J. Nueda, A. Ferrer and A. Conesa, 2015. Data quality aware analysis of differential expression in RNA-seq with NOISeq R/Bioc package. Nucleic Acids Res., 43.
- Tarazona, S., F. García, A. Ferrer, J. Dopazo and A. Conesa, 2011. NOIseq: A RNA-seq differential expression method robust for sequencing depth biases. EMBnet. J., 17: 18-19.
- Hrdlickova, R., M. Toloue and B. Tian, 2017. RNA-Seq methods for transcriptome analysis. WIREs RNA, 8.
- Leggett, R.M., R.H. Ramirez-Gonzalez, B.J. Clavijo, D. Waite and R.P. Davey, 2013. Sequencing quality assessment tools to enable data-driven informatics for high throughput genomics. Front. Genet., 4: 00288.
- Ewels, P., M. Magnusson, S. Lundin and M. Käller, 2016. MultiQC: Summarize analysis results for multiple tools and samples in a single report. Bioinformatics, 32: 3047-3048.
- Li, H. and R. Durbin, 2009. Fast and accurate short read alignment with Burrows-Wheeler transform. Bioinformatics, 25: 1754-1760.
- Grant, G.R., M.H. Farkas, A.D. Pizarro, N.F. Lahens and J. Schug et al., 2011. Comparative analysis of RNA-Seq alignment algorithms and the RNA-Seq unified mapper (RUM). Bioinformatics, 27: 2518-2528.
- Langmead, B. and S.L. Salzberg, 2012. Fast gapped-read alignment with Bowtie 2. Nat. Methods, 9: 357-359.
- Kim, D., G. Pertea, C. Trapnell, H. Pimentel, R. Kelley and S.L. Salzberg, 2013. TopHat2: Accurate alignment of transcriptomes in the presence of insertions, deletions and gene fusions. Genome Biol., 14: R36.
- Kim, D., J.M. Paggi, C. Park, C. Bennett and S.L. Salzberg, 2019. Graph-based genome alignment and genotyping with HISAT2 and HISAT-genotype. Nat. Biotechnol., 37: 907-915.
- Dobin, A., C.A. Davis, F. Schlesinger, J. Drenkow and C. Zaleski et al., 2013. STAR: ultrafast universal RNA-seq aligner. Bioinformatics, 29: 15-21.
- Dobin, A. and T.R. Gingeras, 2015. Mapping RNA‐seq Reads with STAR. Curr. Protoc. Bioinf. : bi1114s51.
- Anders, S., P.T. Pyl and W. Huber, 2015. HTSeq-A Python framework to work with high-throughput sequencing data. Bioinformatics, 31: 166-169.
- Liao, Y., G.K. Smyth and W. Shi, 2014. Feature counts: An efficient general purpose program for assigning sequence reads to genomic features. Bioinformatics, 30: 923-930.
- Raplee, I.D., A.V. Evsikov and C.M. de Evsikova, 2019. Aligning the aligners: Comparison of RNA sequencing data alignment and gene expression quantification tools for clinical breast cancer research. J. Pers. Med., 9: 18.
- Love, M.I., W. Huber and S. Anders, 2014. Moderated estimation of fold change and dispersion for RNA-seq data with DESeq2. Genome Biol., 15: 550.
- Law, C.W., M. Alhamdoosh, S. Su, X. Dong, L. Tian, G.K. Smyth and M.E. Ritchie, 2018. RNA-seq analysis is easy as 1-2-3 with limma, Glimma and edgeR. F1000Research, 5: 1408.
- Joo, M.S., K.H. Pyo, J.M. Chung and B.C. Cho, 2023. Artificial intelligence-based non-small cell lung cancer transcriptome RNA-sequence analysis technology selection guide. Front. Bioeng. Biotechnol., 11: 1081950.
- Sahu, A., J. Mishra and N. Kushwaha, 2022. Artificial intelligence (AI) in drugs and pharmaceuticals. Comb. Chem. High Throughput Screening, 25: 1818-1837.
- Sakellaropoulos, T., K. Vougas, S. Narang, F. Koinis and A. Kotsinas et al., 2019. A deep learning framework for predicting response to therapy in cancer. Cell Rep., 29: 3367-3373.e4.
- James, G., D. Witten, T. Hastie and R. Tibshirani, 2021. Deep Learning. In: An Introduction to Statistical Learning, James, G., D. Witten, T. Hastie and R. Tibshirani (Eds.), Springer, New York, ISBN: 978-1-0716-1418-1, pp: 403-460.
- Wang, G., J.C. Ye and B. de Man, 2020. Deep learning for tomographic image reconstruction. Nat. Mach. Intell., 2: 737-748.
- Muller, A.P.O., C.R. Bom, J.C. Costa, M. Klatt and E.L. Faria et al., 2023. Deep-tomography: Iterative velocity model building with deep learning. Geophys. J. Int., 232: 975-989.
- Chandra, S.S., M.B. Lorenzana, X. Liu, S. Liu, S. Bollmann and S. Crozier, 2021. Deep learning in magnetic resonance image reconstruction. J. Med. Imag. Radiat. Oncol., 65: 564-577.
- Warren, S.L. and A.A. Moustafa, 2023. Functional magnetic resonance imaging, deep learning, and Alzheimer's disease: A systematic review. J. Neuroimaging, 33: 5-18.
- Wennmann, M., P. Neher, N. Stanczyk, K.C. Kahl and J. Kächele et al., 2023. Deep learning for automatic bone marrow apparent diffusion coefficient measurements from whole-body magnetic resonance imaging in patients with multiple myeloma. Invest. Radiol., 58: 273-282.
- Lee, K., J.H. Lockhart, M. Xie, R. Chaudhary and R.J.C. Slebos et al., 2021. Deep learning of histopathology images at the single cell level. Front. Artif. Intell., 4: 754641.
- Rawat, T. and V. Khemchandani, 2017. Feature engineering (FE) tools and techniques for better classification performance. Int. J. Innovations Eng. Technol., 8: 169-179.
- Kuhn, M. and K. Johnson, 2020. Feature Engineering and Selection: A Practical Approach for Predictive Models. CRC Press, United States, ISBN: 9781138079229, Pages: 310.
- Khaire, U.M. and R. Dhanalakshmi, 2022. Stability of feature selection algorithm: A review. J. King Saud Univ.-Comput. Inf. Sci., 34: 1060-1073.
- Saeys, Y., I. Inza and P. Larranaga, 2007. A review of feature selection techniques in bioinformatics. Bioinformatics, 23: 2507-2517.
How to Cite this paper?
APA-7 Style
Neto,
B.F., Dias-Pinto,
J.R., Araldi,
R.P. (2023). Pharma Data Analytics (Pharma Intelligence): Opportunities and Challenges in the Multi-Omics Era of Drug Discovery and Development. Pharmacologia, 14(1), 29-39. https://doi.org/10.17311/pharma.2023.29.39
ACS Style
Neto,
B.F.; Dias-Pinto,
J.R.; Araldi,
R.P. Pharma Data Analytics (Pharma Intelligence): Opportunities and Challenges in the Multi-Omics Era of Drug Discovery and Development. Pharmacologia 2023, 14, 29-39. https://doi.org/10.17311/pharma.2023.29.39
AMA Style
Neto
BF, Dias-Pinto
JR, Araldi
RP. Pharma Data Analytics (Pharma Intelligence): Opportunities and Challenges in the Multi-Omics Era of Drug Discovery and Development. Pharmacologia. 2023; 14(1): 29-39. https://doi.org/10.17311/pharma.2023.29.39
Chicago/Turabian Style
Neto, Benedito, Faustinoni, João Rafael Dias-Pinto, and Rodrigo Pinheiro Araldi.
2023. "Pharma Data Analytics (Pharma Intelligence): Opportunities and Challenges in the Multi-Omics Era of Drug Discovery and Development" Pharmacologia 14, no. 1: 29-39. https://doi.org/10.17311/pharma.2023.29.39

This work is licensed under a Creative Commons Attribution 4.0 International License.